(b) Topic 2: Descriptive Statistics and Probability Calculations
b.1 Symmetry, positively-skewed and negatively-skewed
Symmetric distribution
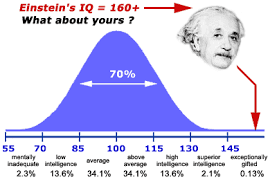
Example: Here is an Excel file [IQScores-1000.csv] of the IQ scores of 1,000 individuals. Plotting the histogram reveals that these scores are distributed in a symmetric manner. 
Note: It is claimed that Marilyn vos Savant has an IQ score of almost 190. We will have more to say about her when we do the "Car and the Goats" problem.
Mac salaries: Skewed or symmetric?

Example: Here's the distribution of the incomes (as an Excel file) of McMaster employees who earned above $100,000 in 2020. [Mac-Salaries-2020.xlsx] Is the distribution symmetric, positively-skewed or negatively-skewed?
This information is public and the most recent data (2020) are available on the Ontario Government web site.
*
...and finally, an article which would interest almost everyone! The following link is excerpted from the book "Who We Are," by C. Rudder, 2014 (Random House). Mr. Rudder was one of the founders of the online dating site OkCupid.com. This is similar to other online dating sites for singles such as eHarmony.com and Match.com.
His article in the National Post:
Dataclysm: The data guru for a popular dating site explains what men and women want from a mate
CAVEAT: The histogram in the above link for a "50-year old woman" would certainly look different if we had data from dating sites such as OurTime.com which caters to people over 50.
An "outlier": Here is a news item about an older man and his wife who was one-third of his age. (A rather sad story.) [.pdf]
Here's a Wikipedia article on age disparity between husband and wife. Interesting histogram!
b.2 Mean and variance of a dataset

Example: I will motivate these concepts with the help of
hot and cold water buckets!
Scenario 1: One bucket (BLUE)
has freezing water at 0C, other (RED) has boiling water at 100C. Average is 50C. Why
am I so uncomfortable?
Scenario 2: One bucket (GREEN)
has lukewarm water at 50C, other (GREEN) has also lukewarm water at 50C. Average is 50C.
So nice!
Both means are the
same but what distinguishes the two scenarios? The Variance!
Example: (Exam scores in a small MBA class) Here is an Excel file of the calculations for mean and
variance. If we have a population of N items, then division for
variance is performed using N. If we have a sample of n items,
then division for variance is performed using n-1.
Example/Exercise: Here is a .csv
file of the same data. Use R to analyze it.
b.3 Probability calculations

Example: Coin Toss  : The fraction of heads obtained in a series of coin tosses approaches 0.5.
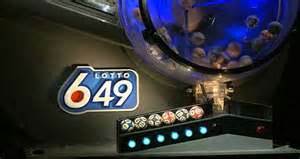
Example: Lotto 6/49 from Ontario Lottery Corporation. This is how they pick the six lucky numbers. 
Now try these functions with (49,6). But be careful with combn(49,6), as your laptop may choke if you don't have enough memory!
Example: Birthdays : In a set of 50
randomly chosen people, what is the probability that any two will have
the same birthday?
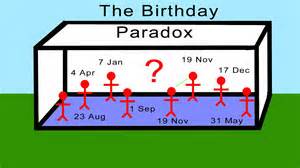
The result may seem paradixocal; so, here's a link that explains the birthday problem.
Here, I explain this problem for the case of finding two matching birthdays as days of the week (M, T, W, Th, F, S, Su).
Example: The Monty Hall Problem and Monty's show "Let's Make a Deal".  [Probably optional in 2021]
Monty asks: "Do you want to switch the door?"
Here are some explanations of this problem.

-
-
-
And here's a
simulation page for this problem that works with Internet Explorer, only.
-
♦ We will talk about two important concepts (independence of
events and mutually exclusive events) before
the next Example.
Independent events
I am holding a fair coin (two sides) and a fair die (six sides). For the coin, the probabiilty of getting any side is 1/2. For the die it is 1/6.
Scenario 1: I roll the die and I get a 4. Now I will flip the coin. What is the probability of getting a Heads? It is still Pr(H) = 1/2. The result of the die roll does not affect the coin's outcome.
Scenario 2; Now I flip the coin and get a Heads (H). I will roll the die now. What is the probability of getting a 4? It is still Pr(4) = 1/6. The result of the coin toss does not affect the die's outcome.
So, here coin toss and die roll outcomes are independent.
Now I roll the die and toss the coin at the same time. What is the probabiltiy of getting a 4 and H? There are a total of 12 outcomes, so it must be 1/12.
We can do it more easily: Pr(4 and H) = Pr(4) x Pr(H) = (1/6) x (1/2) = 1/12. So, for independent events, probability of their joint outcome is simply the product of the individual probabilities.
We note that the 12 outcomes {(1,H), (2,H), ...,(6,H),(1,T), (2,T), ...,(6,T)} are mutually exclusive and collectively exhaustive; i.e., they are all different and they cover all possibilities.
Example: One final and important example: Psy's Gangnam Style on my iPod which has about 500 songs. (I wasted so much money on these amd made iTunes very rich.) See notes.
Two important questions:
(1) What is the probability of hitting Psy's song if I shuffle once?
(2) What is the probability of hitting Psy's song at least once if I shuffle three times?
Top of the Page
(c) Topic 3: Random Variables
c.1 Discrete random variables
Example: A gamble based on a coin toss. Fair gamble vs. Unfair gamble. What is the "average" gain in each gamble? Did you just discover the formula for the expected (mean) gain in these gambles?
Example: Pierik's bikes. We will calculate the
expected (mean) value of demand, E(X); and variance of demand Var(X).
Here's the Excel spreadsheet  for calculating these quantities for the bicycle shop data.

c.2 Binomial distribution (random variable)
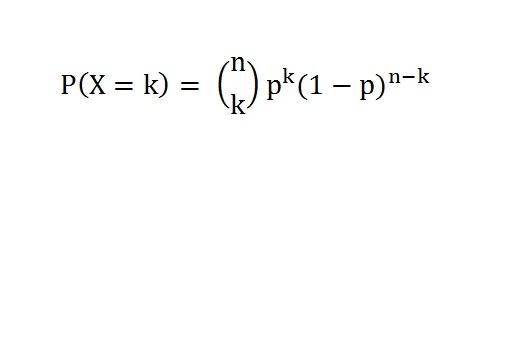 Here is my handwritten notes on the binomial distribution.
 Three tennis balls
  : My success probability at each throw is p = 0.6. What is the
probability that I will have all three balls in the bucket? Two balls?
One ball? Zero?
I do an experiment with the help of a student. Here's the picture from 2019. Rocco is holding the bucket and Erick took the picture, added his commentary and named the file: The Best way to learn Stats
Exercise: Here is a more challenging problem from healthcare area involving the testing of a new drug. Find the solution using Rcmdr. (Answer: 0.74)
c.3 Normal (symmetric) distribution (random variable)

Example: Here is again the Excel file [IQScores-1000.csv] of the IQ scores of 1,000 individuals. Plotting the histogram and other related graphs, especially the Quantile comparison plot, reveal that these scores are distributed normally with a mean of about 100 and a standard deviation of about 15. The probability that someone picked at random from this group has an IQ of at least 145 is 0.0013. Here are the results. 
More Examples:
Normal distribution

What makes a distribution normal? Symmetry, unimodality (one peak) and the requuirements in the following figure.
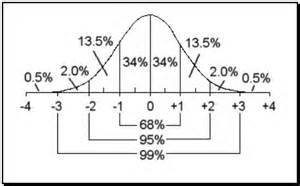
Let's look at some actual datasets.
Heights (in meters) and handspans (in centimeters) of my students.
Data from 2021-2019-2018 (Excel file) Heights appear normal. Handspans not so much. Try to do do the scatterplot for males and females in the same graph.
Binomial and normal : When n is large and p is around 0.5, binomial looks like normal. Let's see it first with Rcmdr.
The next few links illustrate this.
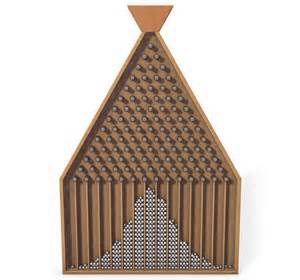
Galton's Board: Here's what happens if you drop a large number of marbles in the board and p = 1/2.  (Binomial turns into normal.) This link
  does it in real time. But here is a cool animation.
Check this out to see how the shape of the normal distribution changes if we vary the mean and standard deviation.
Visual check for normality: This involves Rcmdr's "Quantile comparison plot". Try it with this
Excel file [IQScores-1000.csv] and
Salaries (incomes) of Mac people who made more than $100,000 in 2020. (Excel file)
Here is a Wikipedia article on the normal distribution.
c.3 Expected value and variance
Example: Roulette is a board game with a large "house edge."
Here is the board for American roulette: 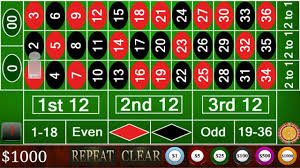
The roulette wheel looks like this: 
Payout amounts if you win your bet in roulette.
This link simulates the roulette game. Let's try it.
Roulette simulator.
We can simulate a roulette roll using Excel's =RANDBETWEEN(1,38)function. Here's an example: RouletteWithExcel
But please note: I am not advocating gambling; in fact, I am very
much against playing such games as they eventually ruin the gambler. The
purpose of this example is to illustrate that roulette is an unfair
game and you shouldn't play it with real money!
- What is the probability of winning if you bet,
- On Red? (If you bet $1 and you win, you get $1)
- On 1st 12? (If you bet $1 and you win, you get $2)
- On 17? (If you bet $1 and you win, you get $35)
- We will do a few examples.
- Warning! In the long run, your winnings are always less than the amount you bet. SO, IF YOU KEEP PLAYING, YOU WILL LOSE EVERYTHING YOU HAVE!
- Why would you want to buy a stock which will surely lose you money in the long run?
The expected value in American Roulette is -5.2%. That is, every time you bet $100, on average you LOSE $5.2.
Top of the Page
(d) Topic 4: Confidence Intervals and Hypothesis Testing
d.1 Confidence intervals
Poll Results

Nanos Poll (again!)
- As of mid-June 2013, Liberals had the support of 34.2% of voters, Conservatives 29.4%, and NDP 25.3%.
- The article states that Nanos surveyed 816 committed voters and the poll is accurate plus or minus 3.5 percentage points, 19 times out of 20.
- So, we are 95% sure that the true proportion of Liberal support is
approximately somewhere between 30.7% (34.2 - 3.5%) and 37.7% (34.2 +
3.5%).
Confidence Intervals for the Proportion p

We will do this with the participation of the class and we will use an inflatable globe to estimate the proportion of the water surface to the total surface of the globe.
Here is the video of this experiment  I recorded in Section C02 (November 4, 2010, Thursday).
*****

Example: (Population proportion) The CI for population proportion is easy to obtain. Suppose you poll 1000 people and 340 of them state that they would vote Liberal, if the election were held today. Here is what we do to find a 95% CI:
> prop.test(340,1000)
1-sample proportions test with continuity correction
data: 340 out of 1000, null probability 0.5
X-squared = 101.761, df = 1, p-value < 2.2e-16
alternative hypothesis: true p is not equal to 0.5
95 percent confidence interval:
0.3108142 0.3704312
sample estimates:
p
0.34
So, the sample proportion is 0.34, with a 95% CI of [0.3108,0.3704], i.e., a margin of error of about 3%. 
Example: Here is an hypothetical problem. One thousand US citizens were asked who they would vote for; Trump or Clinton? The sample results are in this Excel file [Trump-vs-Clinton.xlsx]. What is the CI for Clinton supporters? We use Rcmdr's single-sample proportion test, and obtain these results. Note that this test works with text data as "factors," only. 
Exercise: Find a 99% CI for the population proportion problem (Liberal supporters) discussed above. You will need to refer to the R documentation for prop.test to do this.
d.2 Hypothesis testing
(What is the meaning of the word "hypo" in "hypo-thesis"?
Hypo-allergenic as in  ?
?
Hypo-thermia as in  ?
?
"Hypo-potamus" (??) as in 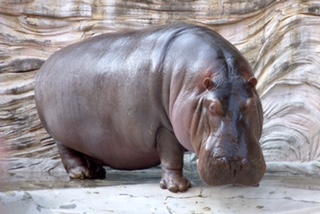 ? Tricked you! This is a hippo-potamus. :-)
"Hypo" means "below, under" in Greek.
"Thesis", is something that is proven to be true.
So, "hypo-thesis" is something that is yet to be proven to be true.
Example: Shishito peppers. It is claimed that 1 in 10 are hot. I am not sure. What if I find 13 hot in a bag of 60? Do the following in R:
> prop.test(13,60,p=0.1)
We'll discuss the results in class.
Example: Lady tasting tea!
In 2021, Coke and Pepsi with Tina.
Now, what does a lady tasting tea have to do with hypothesis testing?
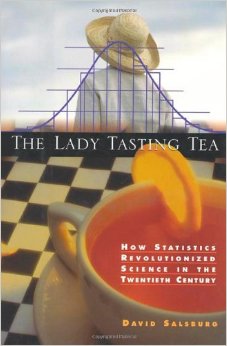
"The Lady Tasting Tea"
: Can tea poured into milk taste differently than that of milk poured
into tea? This experiment was originally designed by Professor Ronald Fisher in the 1920s, and it will help us motivate the discussion of hypothesis testing. We will, however, use Coke and Pepsi in our experiment. The "lady" in the story is Dr. Muriel Bristol of Cambridge University.
She claims that she knows the difference. Here, my null hypothesis is "H0: She is guessing". Now, if she is purely guessing, there is a 0.014 probability of getting all 8 cups correct. This is such an unlikely outcome but if it happens, I am willing to change my mind and reject my null H0 and believe that she can tell the difference. But what if she just guessed and got all correct? Then I made a mistake in changing my mind, but the probability of me making this mistake is only 0.014. This is the p-value.
In case you were wondering, here is the mathematics behind the calculations. In this link you can find the probaibilities of 0, 2, 4, 6 or 8 correct
identifications which uses the hypergeometric probabilities (which we
did not discuss).
Type I and Type II errors

Type I error : In 1959, Steven Truscott was found guilty of murdering his classmate even though he did not
commit any crime. In 2007, he was formally acquitted of the crime. In
2008, the government of Ontario awarded him $6.50 million in
compensation
Type II error : Many people believe that O. J. Simpson had murdered his wife and he should have been found guilty. But after a lenghty trial, he was acquitted in 1995.
Examples
Hypothesis testing in
R (with one or two populations) still uses the t.test function described above.
We now discuss a problem with one population.

Example: The data set [Atkins-Diet.csv] concerns the weight losses experienced by
dieters using the Atkins diet. We want to test Atkins's hypothesis that people
who use their method lose, on average, at least 20 pounds in 6 months. The
p-value is about 0.03 so we reject this hypothesis. However, if the claim is at
least 10 pounds in 6 months, we find p-value as 0.98, so we don't have enough
evidence to reject this claim. Here are the results from Rcmdr. 
Exercise: For the Atkins problem test
the null hypothesis that Atkins users lose, on average, 17 pounds after 6
months. (This is now a two-sided test.)
Exercise: Use the following data
values to test the hypothesis that true mean is 750 vs. the hypothesis that it
differs from 750: (801,814,784,836,820) What is the p-value? (Answer: p = .0023; so reject the null)
![]() (Did Dewey win?)
(Did Dewey win?)


 Here is my
  Three tennis balls


 ?
? ?
? ? Tricked you! This is a hippo-potamus. :-)


