Chapter 3: Probability
Motivating Examples
Coin Toss  : The fraction of heads obtained in a series of coin tosses approaches 0.5.
But what is the probability of having the thumbtack coming up with pointy side up?
Lotto 6/49 from Ontario Lottery Corporation. This is how they pick the six lucky numbers. 
- What is the probability of winning the big prize?
- You have a better chance of being struck by lightning, but someone wins it. Look at this former DSB employee.
- What is the probability of winning in "Baby Lotto 2/4"?
Birthdays : In a set of 50 randomly chosen people, what is the probability that any two will have the same birthday? Let's see.
- Section EC01-Tuesday

- Section C01-Wednesday

- Section C02-Thursday

The result may seem paradixocal; so, here's a link that explains the birthday problem.
Backgammon is played with two sets of 15 checkers and two dice. What is the probability that you get the same number of dots on both dice? What is the probability that the sum of the dots on both dice is 10?
The Monty Hall Problem and Monty's show "Let's Make a Deal".  Here are some explanations of this problem.
Difference Between Statistics and Probability

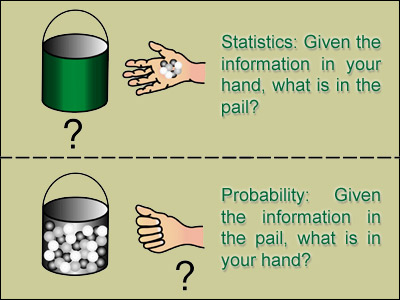
Statistics vs. Probability : (Based on N. Gilbert, Statistics, W. B. Saunders, 1976)
- In statistics, you put your hand into a black box of marbles of different colour, examine your handful, and try to answer the question ``What is in the box?''
- In probability, you look into a transparent box, count the different coloured marbles in it, mix them up well, and then blindly take out one handful; without opening your eyes, you predict how many marbles of each kind are in your hand.
To use a more practical, election polling analogy;
- In statistics, take a list of all registered voters in your riding, randomly choose 100 names, ask them how they will vote in the election next week. Then draw conclusions about who will be elected next week when everyone votes.
- In probability, you know how many voted for each of the candidates C (Conservative), L (Liberal) and N (NDP) last week. Then you randomly choose 100 voters and draw conclusions about how many of these probably voted for candidate C.
: The fraction of heads obtained in a series of coin tosses approaches 0.5.
![]()
![]() Here are some explanations of this problem.
Here are some explanations of this problem. 